Attention! The Humble Visualisations have now been retired. From February 3rd onwards, no new data will be gathered. Existing data (with existing gaps) will remain archived and viewable, and the project sources will remain up on GitHub. For more information, click the About/History tab at the bottom of the screen.
This page aims to be an aid to understanding the statistics for the pay-what-you-want game bundles promoted by Humble Bundle Inc by calculating some extra numbers from the already available stats. You can click the tabs at the bottom of the window for more info (seriously, just click the help one and skim it for a few seconds).
You can show and hide individual bundles in the "chart playground" by clicking on them in the timeline and revenue table. This is also reflected in the X vs Time charts at the bottom of the page (at page load, these show all promotions of the current promotion's type).
Please note that for obvious reasons any in-progress promotion's figures will only be an indication of that promotion's performance so far. The figures for in-progress promotions update at least every hour, so if you're interested, don't forget to check back later.
If you have any questions or comments, please get in touch.
Cheese
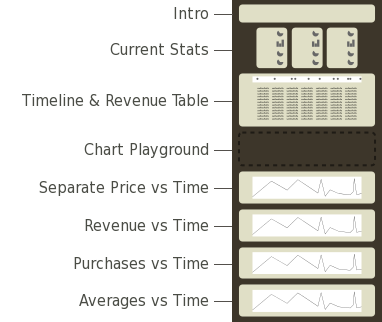
The first set of charts and graphs shows calculated statistics for the current/most recent Humble Bundle promotion, the aggregated statistics for all promotions of that type and the aggregated statistics for all Humble Bundle promotions combined. Following that is an illustrative timeline showing the frequency of promotions and a table showing comparative revenue which can also be clicked to show and hide specific promotions' figures in the "chart playground". Beneath the "chart playground" are charts showing variations in separate price value, revenue, purchases and averages across the promotions shown in the "chart playground" (or all the promotions of the current one's type if nothing is selected).
You can also find an FAQ of sorts by clicking the Footnotes tab above.
You can see something close to the original presenation by following this link. Note that it still uses D3 and has all the same interactivity minus the chart playground.
Don't expect this to work in older browsers. I don't.
1: Promotion dates are recorded when the new promotion title is first seen. Everything older than the Humble Indie Bundle #4 inclusive were manually added in January 2011 with dates sourced from the Humble Indie Bundle article on Wikipedia. End dates are now recorded when "is now over" is detected in the bundle title. End dates for the Android #3 bundle and prior were sourced from the Humble Indie Bundle article on Wikipedia.
Note also that duration is calculated in whole days, and the time at which a bundle is first and last seen may lead to a shorter apparent time.
2: Data is read directly from the Humble Bundle page hourly and stored in a MySQL database. Data for past bundles is assumed to be static (initial values for earlier bundles have been imported from a saved copy of my download page for each bundle - if you notice that the details for an expired bundle are incorrect, please let me know).
3: As noted, the calculated figures have variances. These are most likely the result of rounding, payments of $0.01 and users who did not select or selected multiple operating systems. Bundles without cross-platform stats available (initially the THQ bundle) don't allow per-platform stats to be calculated, and so their total number of purchases appear as a variation. Promotions without cross-platform data do not display variances.
4: "Separate price" values up to and including the Humble Bundle for Android 2 onwards were sourced from developer prices where available (and Steam prices where not, excluding Canabalt, for which the iTunes price was used) as at 11th of April 2012. Values for later bundles have been parsed from the humblebundle.com website. Keep in mind that some bundle titles (including tech demos, prototypes and game jam outcomes) have no price associated with them. The initial separate price value for the Humble Deep Silver Bundle was not parsed correctly, but was confirmed as being $190 by Jeff Rosen.
Though I believe the visualisations present an adequate representation of different aspects of the data available, I make no guarantees about the accuracy of the calculations or the results, and offer transparency instead. The source is available on GitHub (sans db credentials), and a copy of the most recent data set is also available for anybody who wants to see how it works or use it for something else (note that this contains historical tables from previous versions as well as additional hourly data for regular and weekly promotions).
None of the newer bundles are shown. What gives? The Humble Visualisations have been retired and are now in archive mode. From February 3rd 2016 onwards, no new data will be collected. For more information, click the About/History tab above.
Gah! Why do you put Linux first in everything? Whilst I may be biased towards Free/Open Source Software, this has nothing to do with the order in which platforms are displayed. It's just a happy coincidence that alphabetical ordering puts Linux first ;)
Can we see how the charity/developer donations were distributed? Honestly, this is probably the #1 piece of data I'd love to have my hands on. To my knowldege, this information is not readily available for any but the first bundle. If enough people ask me, I'll put together some separate charts for that ;)
Can we see [miscellaneous piece of data not shown on the Humble Bundle website]? Currently, everything that is shown here is derived exclusively from information available from the Humble Bundle website. I think this is an important part of the data's credibility, and I'm not willing to compromise that. There is a lot of information that can be found in Jeffrey and John's GDC 2011 talk if you're keen to know more stuff.
Your JavaScript is awful and you should feel awful!/Can I help?/Where can I send suggestions and feedback? I've got a GitHub repository up for the Humble Visualisations, and I'm keen to have suggestions and feedback as issues there where stuff can be referenced in commits/pull requests. Please do a search before submitting an issue so that we can keep all related discussion together.
You're showing us a lot of stuff here, but you're not telling us what it means? I think it's important to separate information from interpretation, and I'm keen to let other people come to their own conclusions before suggesting what it might all mean. If you click the Sighted Citings tab above, you can see a list of my own and other people's ramblings about and interpretations of the Humble Visualisations' data.
Your excessive verbosity is exciting to me, can I contact you? Sure, why not? Details can be found by clicking the About/History tab above. ^_^
But I don't want to talk to you. Where can I talk to other people? Click on the Discussion tab above to see a list of vaguely official places to converse. That said, please feel welcome to discuss this stuff anywhere you like!
If you find something I've missed, please let me know.
It's been a difficult decision to make, but has been something that's been on my mind for some time. Humble has moved beyond the philosphies and principles that originally inspired and motivated me to start aggregating data. My enthusiasm has been sapped and my passion is gone. I no longer receive notifications of markup changes, so the parser often breaks without my knowledge. Rather than leaving the Humble Visualisations running unmaintained, it feels better to officially retire it.
This page aims to be an aid to understanding the statistics for the pay-what-you-want game bundles promoted by Humble Bundle Inc by calculating some extra numbers from the already available stats. Some additional contextual information is shown if you mouse over each chart/graph. More info/extra notes can be found by clicking on the tabs like the one you clicked to show this :D
What you see here is the third iteration of the Humble Visualisations. The original was a shared Google Docs spreadsheet which calculated additional figures and generated URLs for Google Image Charts from manually entered data. The second used PHP to scrape the humblebundle.com website for data automatically for storage in a MySQL database, and was able to display images alongside the extra figures on a single page as well as show line graphs showing the fluctuations in revenue, purchases and averages across all promotions. As the number of Humble Bundle promotions grew, this became unweildy, and the current version, which uses a similar PHP parser, but provides promotion data via JSON, which is used to generate graphs and charts via D3, a JavaScript based visualisation library, providing more interactivity and customisation of presentation, which you can read mote about by clicking the Howto/Help! tab above. Huzzah!
There are also a bunch of todo items in the GitHub issue list which should give some idea of things that are on the horizon.
Big thanks to the Humble Bundle guys for their prior work in supporting independent game development, supporting worthwhile charities, challenging misconceptions about the gaming industry, actively promoting DRM-free publishing, encouraging the open sourcing of commercial games, and promoting Linux, Mac OS and Windows as being equaly viable gaming platforms.
Thanks to meklu for his robots.txt parser.
Thanks to my fellow SteamLUG community members including (but not limited to) meklu, flibitijibibo, adrian_broher, and xpander69 for testing and encouragement as well as everybody else who has provided feedback along the way.
Thanks to madrang, RobbieThe1st and porc for the discussion in the Steam Powered User Forums that prompted me to start putting together the Google Docs spreadsheet that eventually evolved into what you've seen here.
My name is Josh, but my friends call me Cheese (and you can too - don't you feel special?).
I dabble in a lot of things, but if you're on this page, then the ones that might interest you most are my collection of "Cheese Talks" reviews, articles and interviews where I look at and talk to people and things relating to the gaming and the Free Software world (not necessarily at the same time), the open and closed source games I've worked on, my Patreon campaign, which I use to help support my writing and game development efforts, and maybe twolofbees.com, a cute art-blog-comic thing where I occasionally put fan art for games (and this vaguely relevant image).
I can be followed/stalked/casually observed on twitter as @ValiantCheese.
You may also find me idling in the #humblebundle IRC channel. Details can be found in the Discussion tab above.
We've recently adopted #humblebundle on irc.freenode.net as the go-to place for Humble Visualisations related chat. I can often be found idling as Cheeseness and will respond to pings if I'm around!
Alternatively, if you don't have an IRC client or don't have any idea what any of this means, you can visit this handy webchat URL, type out the annoying captcha and get chatting!
I've been using the #HumVis hashtag in Humble Visualisations related tweets! If you use Twitter, you are welcome to as well!
Less transient discussion on bugs and development is worth conducting in issues on the Humble Visualisations GitHub repository.
Bug and development discussion anywhere else is welcome, of course, though it's worth updating GitHub issues with any relevant conversational outcomes.
The source code for this version of the Humble Visualisations is available from my GitHub repository.
There are a bunch of todo items in the issue list which should give some idea of things that are on the horizon.
Feel free to submit and comment on issues and pull requests. I'll try to respond to everything within a day or two.
Forking is cool, but if you do set up your own copy of stuff, please avoid hammering the Humble Bundle site when pulling data.